
The automation of capturing performance statistics from Network systems is not new. It has been prevalent for quite some time. Many of us have experimented with tools like Python libraries and even Ansible for network devices. However, I have observed that some of the most common examples of network automation are limited only to sending commands and receiving plain text output from Network devices. This approach used to be sufficient until a few years ago, when such tasks were considered outside the scope of traditional Network Administrators and done as favors rather than job responsibilities.
The lines between Operations/Administration and Development have been increasingly blurred, and traditional system/network administrators may find themselves at a disadvantage if they hesitate to embrace automation or take too long to adapt. Today’s expectations are different, and they will only become more demanding in the future. Merely writing a 10-line code snippet to collect interface statistics from a network switch will soon be inadequate. The new norms will require a form of network automation that goes beyond mere token efforts and instead delves into data manipulation, visualization etc.
In fact, let’s pose a question to ourselves… which of the two images below appears more appealing? It’s highly likely that the majority of us would choose the first one. If that’s the case, then why do we still rely heavily on textual information?
In the last post, we discussed how TextFSM can be used to parse unstructured or semi-structured data like the traditional CLI output of network devices and extract relevant information from it just like we do for JSON or XML formatted structured data. In today’s post, we will go over a very simple & straightforward use case that should be more than enough to demonstrate the benefits of bringing visualization techniques into the traditional automation world. We will be using a TextFSM template along with Python’s Matplotlib library to visualize a router’s CPU performance over a period of few hours.
Network Automation & Visualization Example
The Objective is to capture a Cisco router’s CPU usage at one hour interval and plot it as a graph at the end of it. For this exercise, we will capture CPU stats 5 times starting at 8 AM and ending at 12 noon.
The Solution demonstrated through this example involves dividing this network automation task into three different sub-tasks and writing three different functions for each of them. But before that, we need to import some libraries, set up a connection with the Database, write the TextFSM template and declare important variables & Lists. For Database, we are using Python’s SQLite3 library instead of a full fledged third party database. You can use an external database of you wish to. Since this is for demonstration purposes only, I chose to rely on this library as it more than meets my intended purpose.
- Libraries and DB Connection

- TextFSM Template – You can write your own template based on your specific use case or download the ones publicly available from here if that suffices your needs. If you want to learn how to write your own templates then please check out my earlier post.

- Function 1 – It captures router’s CPU stats, parses the data using TextFSM templaes and stores them in a database.

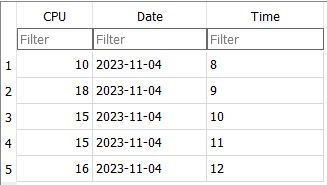
In order for the program to auto run and capture CPU stats every hour, you can set it up as a Cron job. At the end of the 5 hour interval, the database looks something like the following
- Function 2 – It extracts this stored information from the database and puts them in empty Lists.

- Function 3 – It completes the final step of plotting the graph.

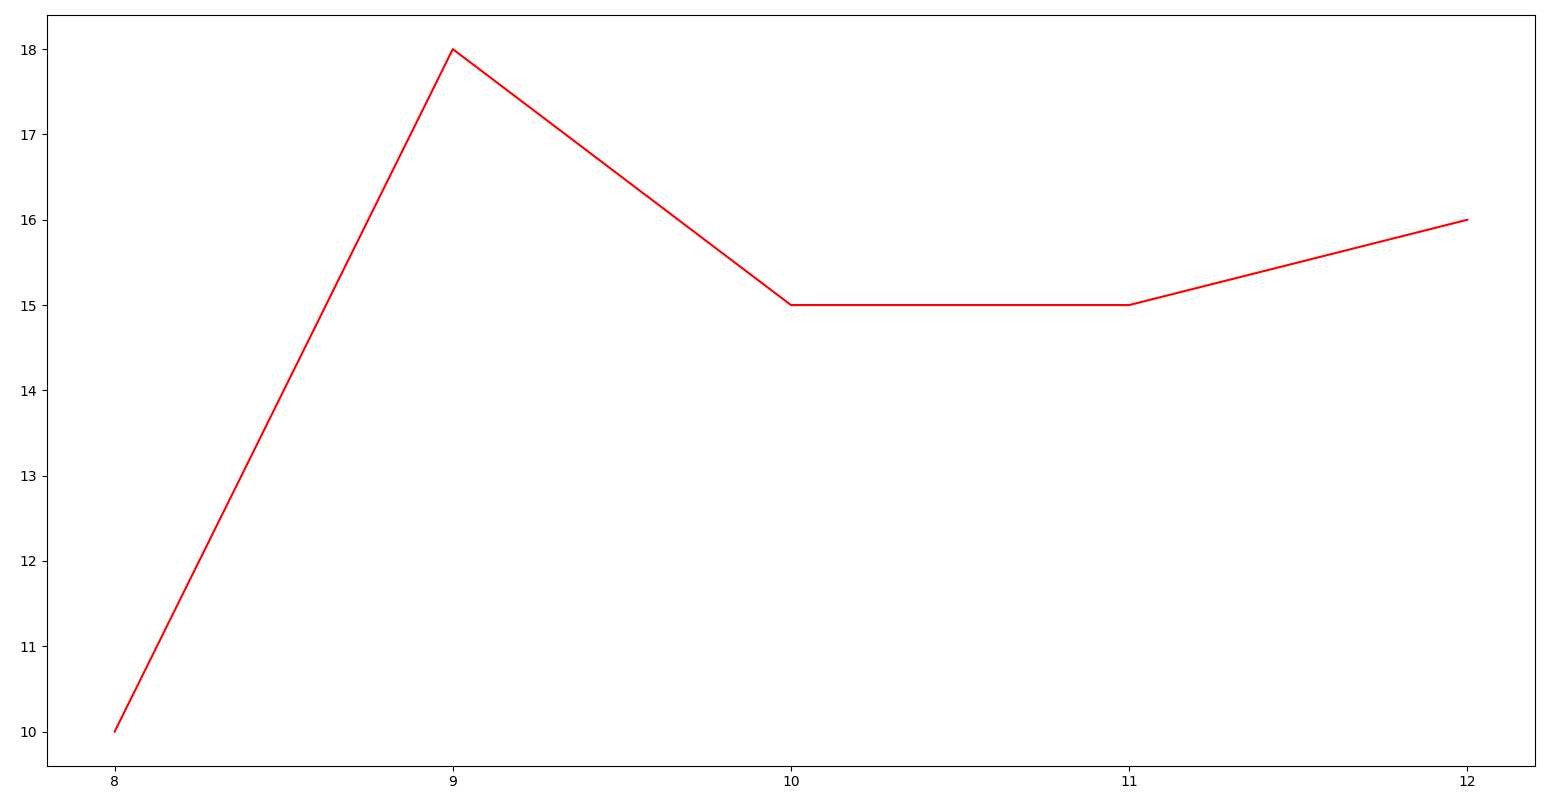
The Final Graph
The graph has “Hours” on the X-Axis and “CPU Percentage” on the Y-Axis.

I hope this post was helpful in demonstrating how powerful visualization can be when paired with traditional automation methods & workflows. This was a rudimentary but very practical real world use case. I would highly suggest to not limit yourself to what’s discussed here. Instead, you should use these principles and concepts to take your automation endeavors even further.
If you have any feedback/suggestions then please drop it in the comments or reach me at LinkedIn. Happy Learnings!!
